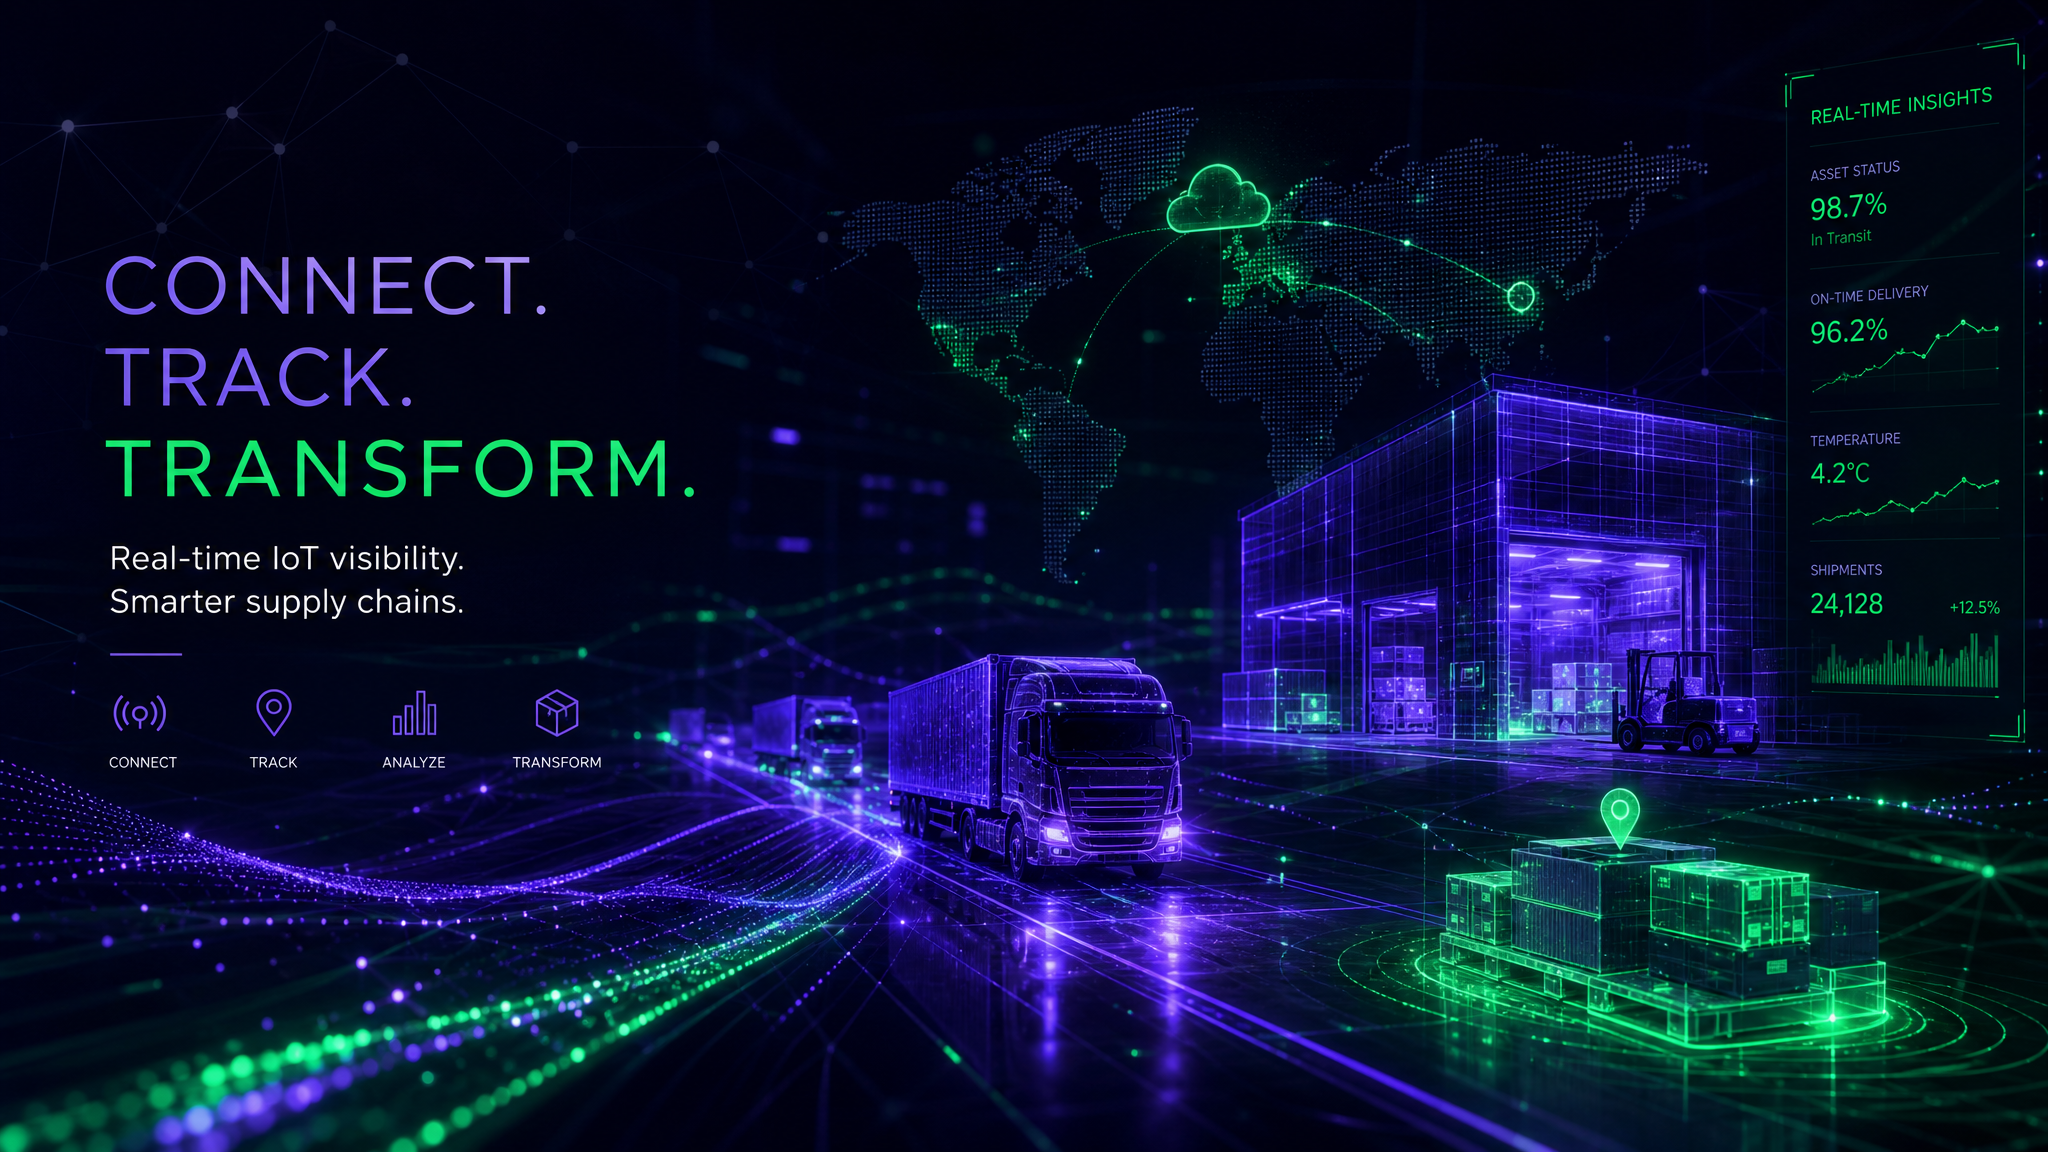
Supply Chain Visibility KPIs That Actually Matter
Most supply chain teams track too many metrics and act on too few. Here's the focused KPI framework that connects IoT visibility data to actual business outcomes.
Your Bee Labels are generating thousands of data points daily: GPS coordinates, temperature readings, shock events, battery levels, arrival times. But data without decision-making is just noise.
After working with hundreds of Decklar deployments, we've identified the 12 KPIs that actually drive action. These metrics fall into three categories—each answering a different business question.
Category 1: "Is Our Product Safe?" (Quality & Compliance KPIs)
These metrics answer the most fundamental question in supply chain visibility: Did your shipment arrive in the condition it left?
1. Temperature Excursion Rate
What it measures: Percentage of shipments that experienced temperature outside acceptable ranges during transit.
How to calculate:
Temperature Excursion Rate = (Shipments with excursions ÷ Total monitored shipments) × 100
Benchmarks:
- Excellent: <1%
- Acceptable: 1–3%
- Needs attention: >5%
Why it matters: For cold chain operations, this directly predicts product integrity. A pharmaceutical customer reduced their excursion rate from 8% to 0.3% within 90 days of deploying Bee Labels—saving an estimated $240K in product loss.
Decklar data source: Temperature sensor readings against configured thresholds in the Honeycomb platform.
2. On-Time, In-Full, In-Condition (OTIF+C) Rate
What it measures: Percentage of deliveries that arrive on time, complete, and without damage.
How to calculate:
OTIF+C Rate = (Perfect deliveries ÷ Total deliveries) × 100
Benchmarks:
- World class: >98%
- Industry average: 85–92%
- Improvement opportunity: <85%
Why it matters: Traditional OTIF misses the "in-condition" piece. Adding environmental monitoring completes the picture—especially for temperature-sensitive, fragile, or high-value goods.
3. Shock Event Frequency
What it measures: Average number of shock/impact events per shipment.
How to calculate:
Shock Event Frequency = Total shock events ÷ Total shipments
Benchmarks:
- Normal handling: <0.5 events per shipment
- Concerning: 0.5–1.5 events per shipment
- Investigation needed: >2 events per shipment
Why it matters: Shock events often precede damage claims. Tracking them helps identify problem carriers, routes, or handling procedures before they become costly.
4. Compliance Documentation Completeness
What it measures: Percentage of shipments with complete digital chain-of-custody records.
How to calculate:
Documentation Completeness = (Shipments with complete records ÷ Total shipments) × 100
Benchmarks:
- Audit-ready: 100%
- Industry standard: 95–99%
- Risk exposure: <95%
Why it matters: For FDA-regulated industries, incomplete documentation can mean product holds, recalls, or regulatory action. Digital records from IoT devices provide automated compliance documentation.
Category 2: "Is Our Operation Efficient?" (Operational KPIs)
These metrics measure how well your supply chain is running—and where friction exists.
5. Average Transit Time Variance
What it measures: Average deviation between planned and actual transit times.
How to calculate:
Transit Time Variance = Actual arrival time − Planned arrival time
Average Variance = Sum of all variances ÷ Number of shipments
Benchmarks:
- Tight control: ±2 hours
- Normal variance: ±4–8 hours
- Scheduling issue: >±12 hours
Why it matters: Consistent variance patterns reveal systemic issues—whether it's unrealistic planning, carrier performance, or facility bottlenecks.
6. Dwell Time at Critical Nodes
What it measures: Average time shipments spend at key locations (warehouses, ports, customs).
How to calculate:
Dwell Time = Departure timestamp − Arrival timestamp at location
Benchmarks:
- Distribution center: 2–6 hours
- Port/airport: 4–24 hours
- Customs clearance: 1–48 hours (highly variable by country)
Why it matters: Excessive dwell time indicates bottlenecks. One customer discovered their average port dwell time was 72 hours—three times industry standard—sparking a facility process review that cut it to 28 hours.
7. Device Activation Success Rate
What it measures: Percentage of deployed Bee Labels that successfully activate and begin reporting.
How to calculate:
Activation Rate = (Successfully activated devices ÷ Total deployed devices) × 100
Benchmarks:
- Excellent: >99%
- Acceptable: 95–99%
- Troubleshooting needed: <95%
Why it matters: Failed activations mean blind spots in your visibility. Common causes include battery issues, cellular coverage gaps, or scan/entry errors.
8. Alert Signal-to-Noise Ratio
What it measures: Percentage of alerts that represent genuine issues requiring action.
How to calculate:
Signal-to-Noise = (Actionable alerts ÷ Total alerts) × 100
Benchmarks:
- Well-tuned: >70%
- Needs tuning: 30–70%
- Alert fatigue territory: <30%
Why it matters: Too many false-positive alerts leads to alert fatigue—where real issues get ignored. This KPI drives continuous threshold refinement.
Category 3: "Is This Worth It?" (Financial & Strategic KPIs)
These metrics justify your visibility investment and guide strategic decisions.
9. Prevented Loss Value
What it measures: Estimated value of losses prevented through early intervention.
How to calculate:
Prevented Loss = (Average shipment value × Excursions detected early)
                + (Theft/damage interventions × Average claim value)
Why it matters: This is the ROI numerator that executives care about. One automotive customer calculated $1.2M in prevented losses in their first year—against a $180K program cost.
Decklar tip: Set up automated excursion alerts with escalation workflows to maximize early intervention opportunities.
10. Insurance Premium Impact
What it measures: Change in cargo insurance premiums attributed to visibility program.
How to track:
- Document pre-visibility loss history (frequency, severity)
- Track post-visibility loss history
- Request carrier risk re-evaluation at renewal
Typical results: 10–25% premium reduction for high-value cargo programs with documented loss prevention.
Why it matters: Insurance savings often pay for the visibility program itself within 12–18 months.
11. Customer Satisfaction Score Impact
What it measures: Change in customer satisfaction attributable to improved delivery visibility.
How to track:
- Survey customers on delivery confidence before/after visibility implementation
- Track Net Promoter Score (NPS) for supply chain touchpoints
- Monitor delivery-related customer service inquiries
Typical results: 15–30% reduction in "where's my shipment" inquiries; 8–12 point NPS improvement.
Why it matters: Supply chain is increasingly a customer experience differentiator. Proactive updates based on real-time data improve relationships.
12. Time-to-Insight
What it measures: Average time from shipment event to actionable insight.
How to calculate:
Time-to-Insight = (Time alert generated) − (Time issue occurred or was detected)
Benchmarks:
- Real-time: <5 minutes
- Near-real-time: 5–30 minutes
- Batch/processed: 1–24 hours
- Legacy/EDI: 24+ hours
Why it matters: In supply chain, minutes matter. The faster you know about a problem, the more options you have to solve it.
Building Your KPI Dashboard: A 3-Phase Approach
Phase 1: Foundation (Weeks 1–4)
Start with the fundamentals:
- Temperature Excursion Rate
- Device Activation Success Rate
- OTIF+C Rate (if applicable)
Why these first: They're unambiguous, easy to calculate, and directly tied to product integrity.
Phase 2: Optimization (Months 2–3)
Add operational depth: 4. Transit Time Variance 5. Dwell Time at Critical Nodes 6. Alert Signal-to-Noise Ratio
Why add these: They reveal process improvement opportunities and system tuning needs.
Phase 3: Strategic (Months 4–6)
Include business impact metrics: 7. Prevented Loss Value 8. Insurance Premium Impact 9. Customer Satisfaction Impact
Why these last: They require historical data and cross-functional tracking—but they're what justify program expansion.
Common KPI Mistakes to Avoid
❌ Tracking Everything
The problem: Dashboards with 40+ metrics create analysis paralysis. The fix: Start with 5–7 KPIs that directly tie to your top business objectives.
❌ Benchmarking Against Industry Averages Only
The problem: Industry averages include companies with vastly different supply chain maturity. The fix: Benchmark against your own historical performance first. Industry data provides context, not targets.
❌ Ignoring Seasonality
The problem: Comparing December pharma shipments (peak cold chain demand) to July performance without adjustment. The fix: Use year-over-year comparisons or seasonally-adjusted baselines.
❌ Confusing Correlation with Causation
The problem: Assuming that because KPIs improved after deploying visibility, the visibility caused the improvement. The fix: Establish control groups when possible, and look for leading indicators (alert response time) that predict lagging outcomes (loss reduction).
❌ Set-and-Forget Thresholds
The problem: Alert thresholds configured at deployment never updated, leading to alert fatigue or missed events. The fix: Monthly threshold reviews for the first quarter, then quarterly. Track your signal-to-noise ratio as a KPI itself.
From Metrics to Action: The Weekly KPI Ritual
Successful visibility programs don't just track KPIs—they act on them. Here's a proven weekly rhythm:
Monday Morning (15 minutes): Review previous week's excursion rates and activation success. Any red flags?
Wednesday Midweek (20 minutes): Analyze dwell time patterns. Any locations trending longer than baseline?
Friday Close (10 minutes): Calculate prevented loss estimate for the week. Share win with stakeholders.
Monthly (1 hour): Full KPI review with trend analysis. Adjust thresholds. Update targets.
Quarterly (2 hours): Strategic review including insurance impact, customer satisfaction metrics, and program ROI.
Tools for KPI Tracking
Decklar Platform:
- Real-time dashboard with configurable widgets
- Automated threshold alerts
- Historical trend analysis
- Export to Excel/CSV for deeper analysis
Common Integrations:
- Power BI / Tableau for executive dashboards
- Excel for ad-hoc analysis and what-if modeling
- Your TMS/ERP for operational correlation
Pro tip: Start with Decklar's built-in reporting before building custom dashboards. The standard reports cover 80% of KPI needs—and they're maintained as the platform evolves.
Summary: The KPI Framework at a Glance
| Category | KPI | Primary Question | Frequency |
|---|---|---|---|
| Quality | Temperature Excursion Rate | Is product safe? | Daily |
| Quality | OTIF+C Rate | Are deliveries perfect? | Weekly |
| Quality | Shock Event Frequency | Is handling appropriate? | Weekly |
| Quality | Documentation Completeness | Are we audit-ready? | Per shipment |
| Operational | Transit Time Variance | Is scheduling accurate? | Weekly |
| Operational | Dwell Time | Where are bottlenecks? | Weekly |
| Operational | Activation Success Rate | Is the system working? | Daily |
| Operational | Alert Signal-to-Noise | Are thresholds tuned? | Monthly |
| Financial | Prevented Loss Value | What's the ROI? | Monthly |
| Financial | Insurance Premium Impact | Are we reducing risk? | Quarterly |
| Strategic | Customer Satisfaction Impact | Are customers happier? | Quarterly |
| Strategic | Time-to-Insight | How fast do we know? | Weekly |
Related Resources
- The Complete Guide to Supply Chain Alert Strategies — Tuning thresholds for maximum signal-to-noise
- Executive Briefing: Supply Chain Visibility in 15 Minutes — Presenting these KPIs to leadership
- QBR Metrics & Customer Success Playbook — Quarterly business review framework using these KPIs
- From Sensors to Insights: How IoT Data Actually Flows — Technical foundation for understanding these metrics
Questions about implementing these KPIs? Contact your Decklar Customer Success Manager or email jeffcalabro32@gmail.com.
Gavin writes about supply chain visibility, IoT implementation, and getting actual business value from tracking technology. He's helped hundreds of companies deploy their first Bee Labels and optimize existing programs.

Written by Gavin
Your dedicated AI-powered customer success partner at Decklar. Questions? I'm always here to help.
Voice Discussion
Have thoughts? Record a voice comment or reply to join the conversation with Gavin.